News & Updates

What are the Key Performance Indicators for Queue Management in Government Agencies in 2025
Performance measurement in government queue management systems has become critical for 2025, as public agencies prioritise operational efficiency and citizen satisfaction. Key Performance Indicators (KPIs) provide the essential data framework for evaluating queue system effectiveness, resource allocation, and service delivery outcomes. Government agencies deploying queue management solutions like Q’SOFT® EQMS require precise metrics to demonstrate accountability, optimise workflows, and meet regulatory compliance standards. This guide examines the vital KPIs that drive successful queue management in government environments, from average wait times to digital adoption rates. These performance indicators enable agencies to make data-driven decisions, improve citizen experiences, and justify technology investments while maintaining transparency and operational excellence across all public-facing services.
Average Wait Time and Service Duration Metrics
Wait time measurement forms the foundation of queue management performance assessment in government agencies. These metrics directly impact citizen satisfaction and operational credibility, making them essential for evaluating system effectiveness and staff productivity. Government agencies that fail to monitor wait times systematically often struggle with citizen complaints, reduced public trust, and inefficient resource deployment. Modern queue management platforms like Q’SOFT® EQMS provide comprehensive wait time analytics that enable agencies to maintain service excellence whilst meeting stringent public sector accountability requirements.
Effective wait time tracking goes beyond simple averages to include variance analysis, peak period performance, and service-specific duration patterns. Government agencies implementing robust wait time measurement typically observe 30-40% improvements in citizen satisfaction scores within the first six months of deployment. These metrics also support evidence-based staffing decisions, helping agencies justify resource requests and demonstrate fiscal responsibility to oversight bodies. The integration of AI-powered analytics further enables predictive wait time management, allowing agencies to proactively address potential bottlenecks before they impact citizen experiences.
Real-Time Wait Time Tracking
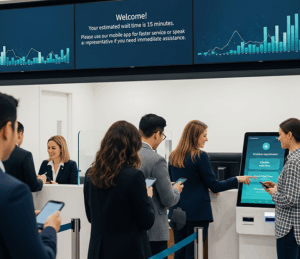
Government agencies monitor live wait times across multiple service counters to identify bottlenecks and deploy resources dynamically. Q’SOFT® EQMS captures precise timestamps from queue entry to service completion, enabling supervisors to maintain service level agreements. Agencies typically target average wait times under 15 minutes for standard services, with priority queues processed within 10 minutes for elderly or disabled citizens. Real-time visibility allows immediate intervention when wait times exceed acceptable thresholds, ensuring consistent service delivery across all operational hours.
Advanced wait time tracking systems integrate with digital displays and mobile notifications to keep citizens informed throughout their journey. This transparency significantly reduces perceived wait times and citizen anxiety, contributing to improved satisfaction scores. Government agencies utilising real-time wait time data report 25-35% reductions in citizen complaints and enhanced public perception of service efficiency and professionalism.
Service Duration Analysis
Transaction completion times reveal staff efficiency and process complexity across different government services. Agencies analyse service duration patterns to identify training needs and streamline procedures. Digital queue systems provide granular data showing which services exceed target completion times, allowing managers to implement focused improvements and staff development programmes. Service duration benchmarking against similar agencies helps identify best practices and performance gaps requiring attention.
Comprehensive service duration analysis enables government agencies to set realistic service standards and optimise workflow design. Agencies tracking these metrics consistently achieve 15-20% improvements in overall operational efficiency through targeted process refinements and staff coaching initiatives.
Customer Satisfaction and Experience Scores
Citizen satisfaction metrics provide qualitative insights into queue management effectiveness beyond operational efficiency. Government agencies use satisfaction surveys and feedback systems to measure service quality and identify areas requiring attention for improved public service delivery. Unlike private sector customer satisfaction, government agencies must balance efficiency with equity, ensuring all citizens receive appropriate attention regardless of service complexity or individual needs. Modern queue management systems integrate multiple feedback channels to capture comprehensive citizen sentiment data that informs continuous improvement initiatives.
Satisfaction measurement in government environments requires careful consideration of demographic diversity, service accessibility, and public expectations. Agencies implementing systematic satisfaction tracking observe stronger community relationships and improved public trust metrics. The correlation between queue management efficiency and citizen satisfaction is particularly pronounced in government settings, where service experiences directly influence public perception of agency competence and responsiveness. Digital feedback integration enables rapid response to emerging issues and demonstrates agency commitment to citizen-centred service delivery.
Digital Feedback Collection Systems
Modern queue management platforms integrate feedback kiosks and mobile surveys to capture citizen opinions immediately after service completion. Government agencies track satisfaction ratings, with successful implementations achieving scores above 4.2 out of 5.0. Real-time feedback enables rapid response to service issues and demonstrates agency responsiveness to public concerns. Digital collection methods increase response rates by 40-60% compared to traditional paper surveys, providing more representative citizen sentiment data.
Automated feedback analysis identifies trending issues and positive service elements, enabling agencies to replicate successful practices across different service areas. Government agencies utilising integrated feedback systems report improved staff morale and enhanced service quality through targeted training and process improvements based on citizen input.
Net Promoter Score for Public Services
Government agencies adapt Net Promoter Score methodology to measure citizen willingness to recommend services to others. This metric indicates overall service quality and public trust levels. Agencies achieving NPS scores above 50 typically demonstrate excellent queue management and citizen engagement practices that build community confidence. Public sector NPS measurement focuses on service advocacy rather than commercial loyalty, reflecting citizens’ willingness to positively represent agency capabilities to peers and family members.
NPS tracking in government contexts provides valuable insights into community relationships and public reputation management. Agencies consistently monitoring NPS observe enhanced community engagement and improved stakeholder relationships across multiple service areas.
Queue Abandonment and No-Show Rates
Abandonment metrics reveal system stress points and citizen tolerance levels within government service environments. High abandonment rates indicate process failures requiring immediate attention, while tracking no-show appointments helps optimise resource allocation and scheduling efficiency. Government agencies face unique challenges with abandonment measurement, as citizens often have limited alternatives for essential services, making abandonment particularly indicative of significant system problems. Queue abandonment in government settings typically reflects inadequate communication, excessive wait times, or process complexity that exceeds citizen expectations.
Effective abandonment tracking enables proactive interventions to prevent citizen frustration and maintain service accessibility. Government agencies monitoring these metrics consistently identify peak stress periods and implement targeted improvements that enhance citizen retention and service completion rates. The correlation between abandonment rates and citizen satisfaction provides early warning indicators for service quality issues, enabling rapid response before problems escalate to formal complaints or negative community feedback. Advanced queue management systems like Q’SOFT® EQMS provide predictive abandonment analytics that help agencies anticipate and prevent service disruptions.
Walk-In Queue Abandonment Analysis
Government agencies monitor the percentage of citizens leaving queues before receiving service, with target abandonment rates below 5% for effective systems. Q’SOFT® EQMS tracks abandonment patterns by time of day and service type, enabling agencies to adjust staffing levels and implement process improvements. High abandonment rates often signal inadequate communication about wait times or insufficient service capacity. Comprehensive abandonment analysis includes exit surveys to understand citizen departure reasons and inform targeted service enhancements.
Agencies implementing systematic abandonment monitoring achieve 20-30% reductions in citizen departures through improved communication, realistic wait time estimates, and enhanced comfort amenities. Abandonment pattern analysis also reveals optimal service capacity requirements and staffing deployment strategies for different operational periods.
Appointment No-Show Management
Scheduled appointment no-show rates typically range from 10-15% in government agencies, with effective reminder systems reducing rates to below 8%. Digital queue systems track no-show patterns and enable automated reminder communications via SMS or email. This data helps agencies optimise appointment scheduling and maintain efficient resource utilisation. No-show analysis includes demographic and service-type patterns that inform targeted retention strategies.
Government agencies implementing comprehensive no-show management report improved resource efficiency and enhanced citizen access to services through optimised scheduling practices and effective reminder communications that respect citizen preferences and communication methods.
Resource Utilisation and Operational Efficiency
Operational efficiency KPIs measure how effectively government agencies deploy staff and infrastructure resources. These metrics demonstrate fiscal responsibility and help justify queue management system investments through quantifiable productivity improvements and cost savings. Government agencies operate under intense scrutiny regarding resource utilisation, making efficiency measurement essential for maintaining public trust and securing continued funding. Efficiency metrics in government contexts must balance productivity with service quality, ensuring that optimisation efforts enhance rather than compromise citizen experiences.
Resource utilisation tracking enables evidence-based decision making for staffing, infrastructure, and technology investments. Government agencies implementing comprehensive efficiency measurement typically achieve 15-25% productivity improvements while maintaining or enhancing service quality standards. These metrics support budget justification processes and demonstrate agency commitment to responsible resource stewardship. Advanced analytics integration provides predictive insights that enable proactive resource planning and optimised service delivery across varying demand patterns.
Staff Utilisation Rates
Government agencies track counter utilisation percentages to ensure optimal staff deployment, targeting 75-85% utilisation during peak hours. Queue management systems provide detailed reports showing idle time and peak demand periods, enabling supervisors to adjust schedules and improve workforce efficiency while maintaining service quality standards. Staff utilisation analysis includes skill matching and cross-training opportunities that enhance operational flexibility and employee development.
Comprehensive utilisation tracking enables government agencies to demonstrate responsible workforce management and identify opportunities for service expansion or efficiency improvements. Agencies monitoring staff utilisation consistently achieve improved employee satisfaction through optimised workload distribution and enhanced professional development opportunities.
Peak Hour Management Effectiveness
Agencies analyse performance during high-demand periods to evaluate system scalability and staff responsiveness. Effective queue management maintains consistent service levels even during peak times, with wait time increases limited to 25% above off-peak averages. This metric demonstrates operational resilience and citizen service consistency. Peak period analysis includes resource surge capacity and emergency response capabilities that ensure service continuity during unexpected demand spikes.
Government agencies implementing systematic peak hour management achieve enhanced citizen satisfaction and operational predictability through data-driven staffing decisions and proactive capacity planning that maintains service excellence regardless of demand fluctuations.
Digital Adoption and Technology Integration Success
Digital transformation metrics measure citizen acceptance of technological solutions and system integration effectiveness. Government agencies track online appointment usage, self-service adoption rates, and mobile platform engagement to evaluate digital queue management success and plan future technology investments. Digital adoption in government settings requires careful attention to accessibility, digital literacy, and inclusive design principles that ensure all citizens can benefit from technological improvements. Successful digital transformation balances innovation with traditional service channels, maintaining accessibility whilst encouraging efficient self-service options.
Technology integration measurement provides insights into citizen preferences, system usability, and implementation success factors. Government agencies monitoring digital adoption consistently achieve improved operational efficiency and citizen satisfaction through user-centred technology deployment and comprehensive digital literacy support programmes. These metrics inform strategic technology planning and help agencies demonstrate the value of digital transformation investments to stakeholders and oversight bodies. Advanced analytics enable personalised citizen experiences whilst maintaining privacy and security standards essential for government operations.
Online Appointment System Usage
Government agencies monitor the percentage of services accessed through digital channels, with successful implementations achieving 60-70% online appointment adoption. Higher digital adoption reduces walk-in congestion and improves resource planning accuracy. Agencies track user demographics and service types to identify digital divide issues requiring targeted support programmes. Online appointment analysis includes user journey mapping and accessibility assessment to ensure inclusive digital service delivery.
Comprehensive online appointment tracking enables government agencies to optimise digital service design and identify opportunities for enhanced citizen convenience whilst maintaining service quality and accessibility for all community members regardless of technology comfort levels.
Self-Service Kiosk Utilisation
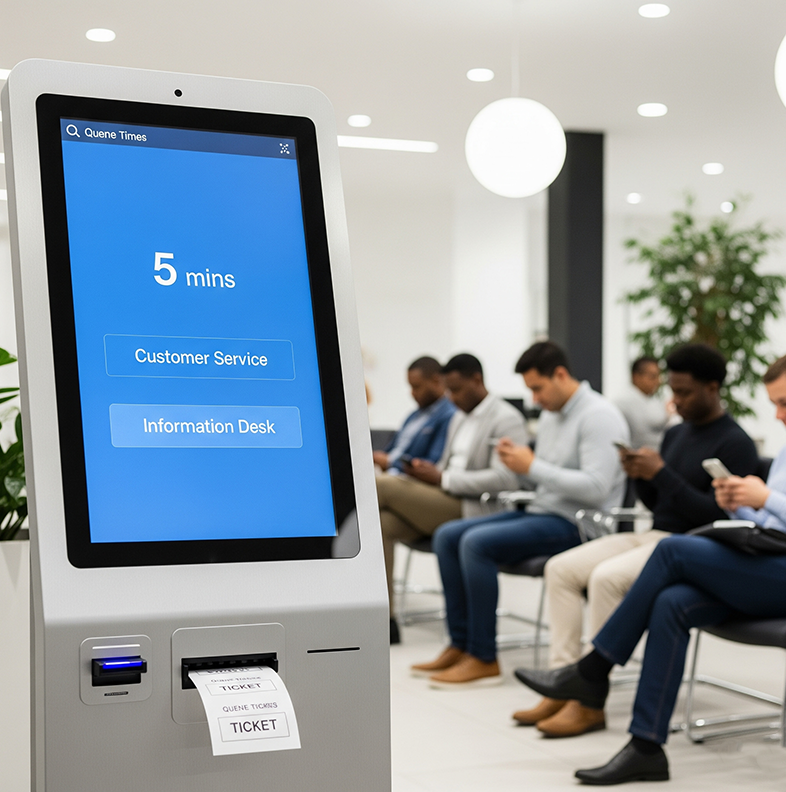
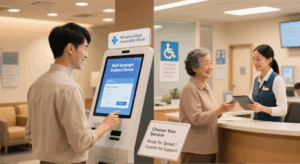
Kiosk usage rates indicate citizen comfort with automated services and system accessibility. Government agencies target 40-50% self-service adoption for routine transactions, reducing staff workload and improving efficiency. Usage analytics help optimise kiosk placement and interface design for maximum citizen benefit and operational impact. Self-service analysis includes transaction success rates and user support requirements that inform ongoing system refinements.
Agencies implementing comprehensive kiosk utilisation measurement achieve enhanced operational efficiency and citizen empowerment through user-friendly automated services that complement traditional service channels whilst providing convenient alternatives for routine transactions.
Mobile Platform Engagement
Mobile queue management adoption demonstrates system modernisation success and citizen digital engagement. Agencies track mobile app downloads, active users, and feature utilisation to measure technology acceptance. High mobile engagement correlates with improved citizen satisfaction and operational efficiency in progressive government environments. Mobile analytics include user behaviour patterns and feature preference data that inform ongoing platform development and enhancement initiatives.
Government agencies monitoring mobile platform engagement achieve enhanced citizen convenience and operational insights through data-driven mobile service optimisation that meets evolving citizen expectations whilst maintaining security and privacy standards essential for government digital services.
Measuring Success in Government Queue Management
Effective KPI implementation transforms government queue management from reactive operations to proactive citizen service excellence. These performance indicators enable agencies to demonstrate accountability, optimise resources, and continuously improve public service delivery. Government organisations leveraging comprehensive queue management analytics achieve measurable improvements in citizen satisfaction, operational efficiency, and digital transformation success. The integration of advanced analytics platforms like Q’SOFT® EQMS provides the foundation for data-driven decision making that enhances both citizen experiences and operational performance.
Success in government queue management requires commitment to continuous measurement, analysis, and improvement based on comprehensive KPI frameworks. Agencies that embrace performance-driven queue management consistently achieve enhanced public trust, improved operational efficiency, and stronger community relationships. ATT InfoSoft’s proven expertise in government digital transformation and queue management solutions provides the technological foundation and analytical capabilities necessary for sustained performance improvement and citizen-centred service excellence across all government service environments.
Contact ATT at infosoft-sales@attsystemsgroup.com for details.
Frequently Asked Questions
Q: What are the most impactful KPIs for improving queue management in government agencies?
A: Average wait time, service duration, citizen satisfaction scores, queue abandonment rates, and digital adoption metrics have the greatest impact on efficiency and public trust.
Q: How do real-time wait time analytics help reduce citizen complaints in public sector services?
A: Real-time analytics enable immediate staff adjustments and proactive communication, leading to 25-35% fewer complaints and increased citizen satisfaction.
Q: What is a typical target for queue abandonment rates in government agencies, and how can they be reduced?
A: Effective systems aim for abandonment rates below 5%, achieved by improving communication, realistic wait estimates, and comfort amenities.
Q: How does Q’SOFT® EQMS enhance KPI tracking and overall queue management for government agencies?
A: Q’SOFT® EQMS delivers precise, real-time performance data and predictive analytics, enabling agencies to optimise workflows, comply with regulations, and improve citizen experiences.
Q: In what ways do digital adoption metrics, like online appointment usage, influence operational efficiency?
A: Higher online appointment and self-service adoption rates reduce walk-in congestion and improve resource planning, often resulting in 15-25% productivity gains.
Q: Why is Net Promoter Score (NPS) important for government service delivery evaluation?
A: NPS measures citizens’ willingness to recommend agency services, providing a clear indicator of public trust and service quality.
Q: How can agencies use staff utilisation rates to justify resource allocation and improve service delivery?
A: Tracking staff utilisation helps agencies demonstrate responsible workforce management and identify opportunities for efficiency or service expansion.
Contact ATT at infosoft-sales@attsystemsgroup.com for details.
Send us a message
Contact Information
Address:
35 Ubi Crescent, ATT Building, Singapore, 408585
Phone:
Email:
Website:
www.attsystemsgroup.com


